Find theft, waste, and over-portioning in dollars.
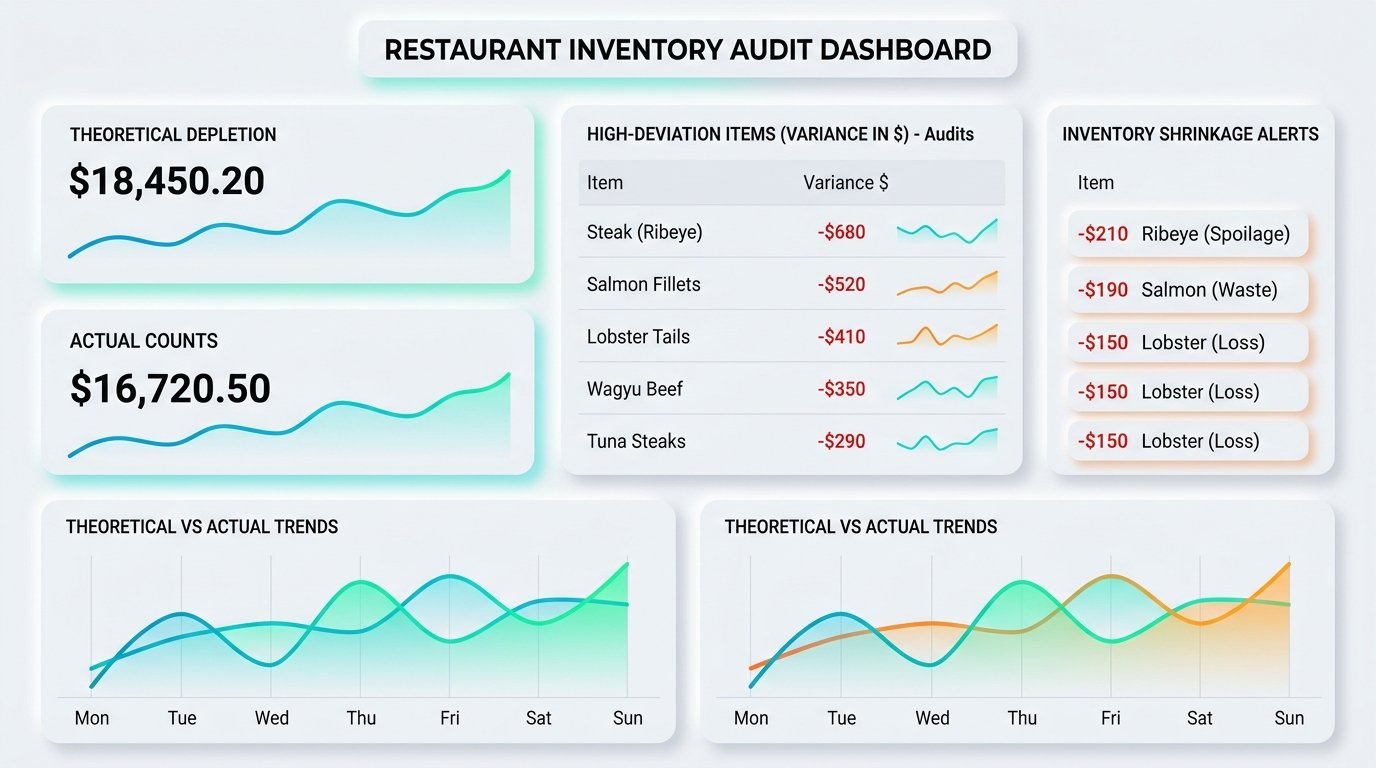
Compare theoretical inventory — what you should have on hand based on POS sales and recipes — against actual counts. Variance shows up in dollars, not mystery shrinkage on a clipboard.
500K+
Plates costed
12K+
Independent operators
98.4%
AI extraction accuracy
Best-in-class Variance Audits for independent operators
Theoretical depletion
Every ticket sold decrements inventory theoretically based on live recipe specs — including yield and prep items.
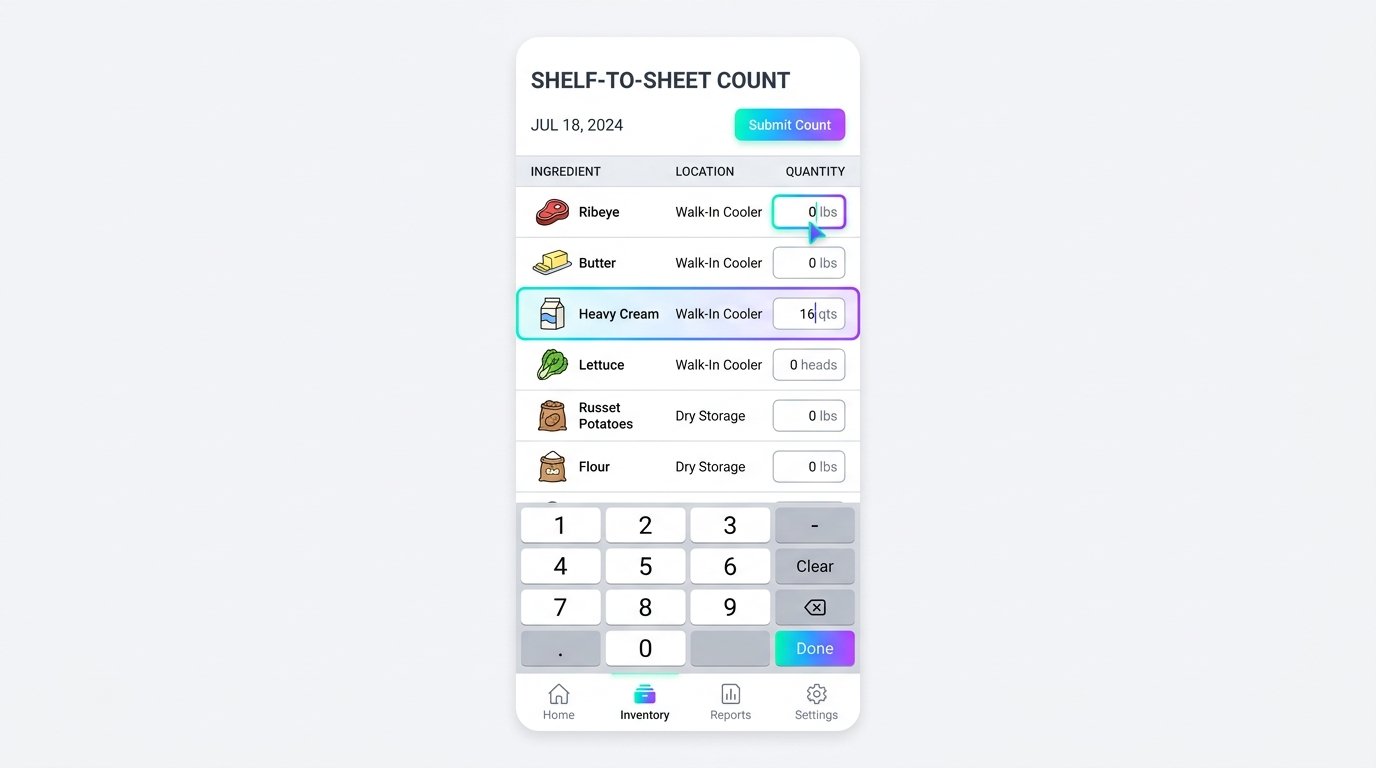
Count sheet workflows
Structured count templates by walk-in, dry storage, or bar — faster than ad-hoc clipboards and tied to the same ingredient master.
Shrinkage attribution
Separate unexplained variance from known waste events so managers focus on fixable leaks.
Trend monitoring
Track whether chicken variance is a one-night portioning issue or a four-week drift that needs a menu fix.
Location comparison
Multi-unit groups rank stores by variance dollars — coach the outliers with shared recipe standards.
Integration-ready exports
Push variance summaries to accounting or ops review without rebuilding numbers in Excel.
From raw inputs to actionable plate cost
POS-driven theoretical usage by recipe
Recipes define theoretical depletion per POS item sold.
Shelf-to-sheet mobile-friendly counting
Shelf-to-sheet counts capture on-hand quantity per ingredient or category.
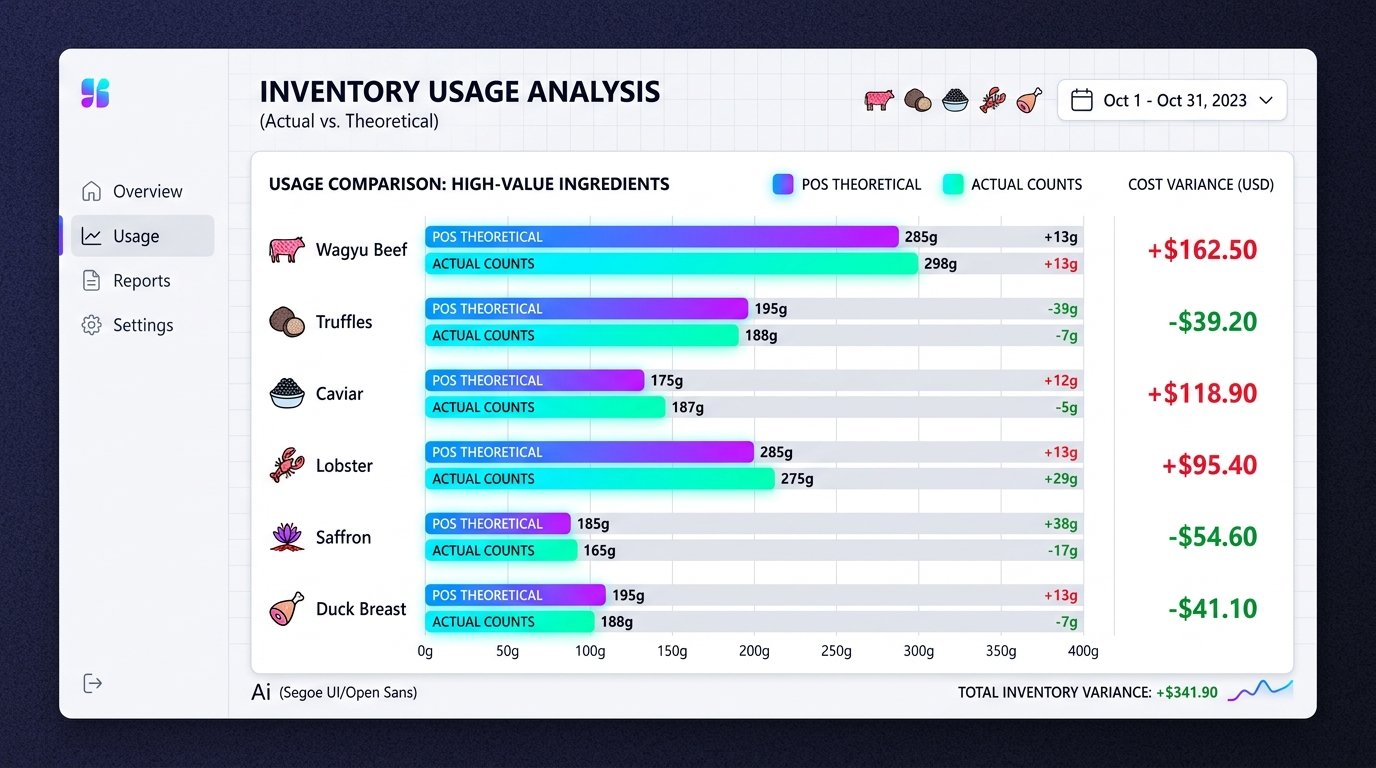
Dollarized variance by item and category
The engine compares theoretical vs actual usage for the period.
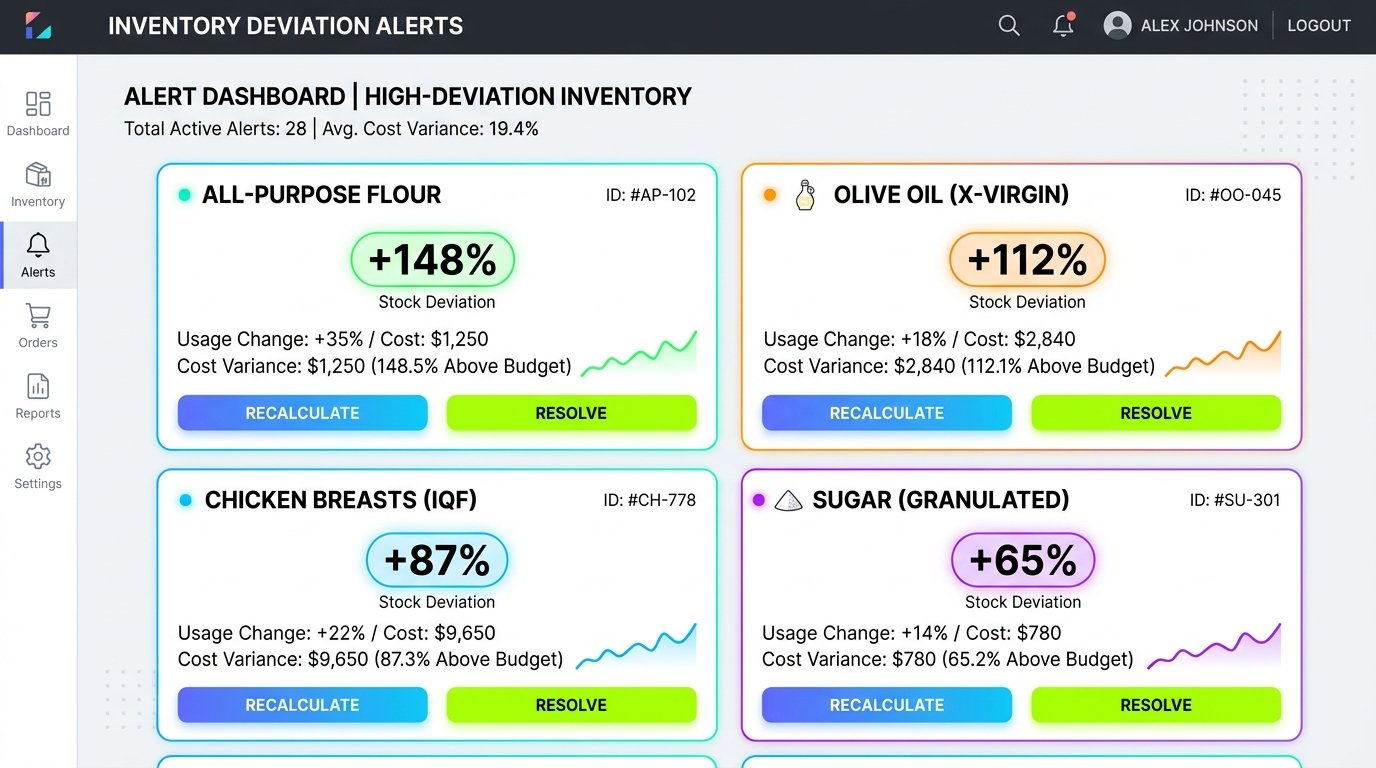
Alerts when deviation exceeds your threshold
High-deviation SKUs surface with dollar impact and trend lines.
Your recipes say you should have spent X. You actually spent more. That gap is over-portioning, waste, and theft — and standard reports never tell you which. Monthly clipboard counts never tie back to what you sold.
- ✓POS-driven theoretical usage by recipe
- ✓Shelf-to-sheet mobile-friendly counting
- ✓Dollarized variance by item and category
- ✓Alerts when deviation exceeds your threshold
- See margin leaks in dollars, not unexplained food cost %
- Coach portioning with data instead of intuition
- Tie inventory discipline directly to what the POS says you sold
Start using Variance Audits today.
Try CulinaryInventory free — cost one dish and see if the numbers surprise you.